9 Inference of Microbial Ecological Networks
More information on SPIEC-EASI.
The input for SPIEC-EASI is a counts table. The normalization and tranformation is done by the function.
This step is heavy on computational memory and slow. Noise filtered OTU-OTU level covariance would be ideal.
Load packages and data
library(devtools)
install_github("zdk123/SpiecEasi")

# Other packages you need to install are
# install.packages('igraph')

install.packages("intergraph")
install.packages("GGally")
devtools::install_github("briatte/ggnet")

install.packages("network")
install.packages("ggnetwork")library(microbiome) # data analysis and visualisation
library(phyloseq) # also the basis of data object. Data analysis and visualisation
library(RColorBrewer) # nice color options
library(ggpubr) # publication quality figures, based on ggplot2
library(dplyr) # data handling
library(SpiecEasi) # Network analysis for sparse compositional data
library(network)
library(intergraph)
#devtools::install_github("briatte/ggnet")
library(ggnet)
library(igraph)Read data
Select only stool samples
We will subset our data to include only stool samples.
For testing reduce the number of ASVs
ps1.stool.otu <- prune_taxa(taxa_sums(ps1.stool) > 100, ps1.stool)

# Add taxonomic classification to OTU ID
ps1.stool.otu.f <- microbiomeutilities::format_to_besthit(ps1.stool.otu)
## Warning: replacing previous import 'ggplot2::alpha' by 'microbiome::alpha' when
## loading 'microbiomeutilities'## Taxonomy Table: [6 taxa by 6 taxonomic ranks]:
## Domain Phylum Class Order
## 9410491526 "Bacteria" "Bacteroidetes" "Bacteroidia" "Bacteroidales"
## 9410491516 "Bacteria" "Bacteroidetes" "Bacteroidia" "Bacteroidales"
## 9410492612 "Bacteria" "Bacteroidetes" "Bacteroidia" "Bacteroidales"
## 9410491521 "Bacteria" "Bacteroidetes" "Bacteroidia" "Bacteroidales"
## 9410491824 "Bacteria" "Bacteroidetes" "Bacteroidia" "Bacteroidales"
## 9410491817 "Bacteria" "Bacteroidetes" "Bacteroidia" "Bacteroidales"
## Family Genus
## 9410491526 "Bacteroidaceae" "Bacteroides"
## 9410491516 "Bacteroidaceae" "Bacteroides"
## 9410492612 "Bacteroidaceae" "Bacteroides"
## 9410491521 "Bacteroidaceae" "Bacteroides"
## 9410491824 "Bacteroidaceae" "Bacteroides"
## 9410491817 "Bacteroidaceae" "Bacteroides"Check the difference in two phyloseq objects.
9.1 Prepare data for SpiecEasi
The calculation of SpiecEasi are time consuming. For this tutorial, we will have the necessary input files for SpiecEasi.
- OTU table
- Taxonomy table
We save it as .rds object.
otu.c <- t(otu_table(ps1.stool.otu.f)@.Data) #extract the otu table from phyloseq object

tax.c <- as.data.frame(tax_table(ps1.stool.otu.f)@.Data)#extract the taxonomy information

head(tax.c)
## Domain Phylum Class Order
## OTU-9410491526:Bacteroides Bacteria Bacteroidetes Bacteroidia Bacteroidales
## OTU-9410491516:Bacteroides Bacteria Bacteroidetes Bacteroidia Bacteroidales
## OTU-9410492612:Bacteroides Bacteria Bacteroidetes Bacteroidia Bacteroidales
## OTU-9410491521:Bacteroides Bacteria Bacteroidetes Bacteroidia Bacteroidales
## OTU-9410491824:Bacteroides Bacteria Bacteroidetes Bacteroidia Bacteroidales
## OTU-9410491817:Bacteroides Bacteria Bacteroidetes Bacteroidia Bacteroidales
## Family Genus
## OTU-9410491526:Bacteroides Bacteroidaceae Bacteroides
## OTU-9410491516:Bacteroides Bacteroidaceae Bacteroides
## OTU-9410492612:Bacteroides Bacteroidaceae Bacteroides
## OTU-9410491521:Bacteroides Bacteroidaceae Bacteroides
## OTU-9410491824:Bacteroides Bacteroidaceae Bacteroides
## OTU-9410491817:Bacteroides Bacteroidaceae Bacteroides
## best_hit
## OTU-9410491526:Bacteroides OTU-9410491526:Bacteroides
## OTU-9410491516:Bacteroides OTU-9410491516:Bacteroides
## OTU-9410492612:Bacteroides OTU-9410492612:Bacteroides
## OTU-9410491521:Bacteroides OTU-9410491521:Bacteroides
## OTU-9410491824:Bacteroides OTU-9410491824:Bacteroides
## OTU-9410491817:Bacteroides OTU-9410491817:Bacteroides9.2 SPIEC-EASI network reconstruction
More information on SPIEC-EASI.
The input for SPIEC-EASI is a counts table. The normalization and tranformation is done by the function. This is very handy tool.
This step is heavy on computational memory and very slow. For this workshop we have already have the output and will skip this chuck.
# In practice, use more repetitions
set.seed(1244)
net.c <- spiec.easi(otu.c, method='mb', icov.select.params=list(rep.num=50)) # reps have to increases for real data

# saveRDS(net.c, "input_data/net.c.rds")

#please use more numebr of rep.num (99 or 999) the paraemters

## Create graph object and get edge values
We have save the output of net.c to save time
The output of spiec.easi is stored in ./input_data/ as stool.net.c.rds. Read this file in R and follow the steps below.
# the PC has low processing power, you can read the otuput created by us present in the input_data folder.
source("scripts/symBeta.R") # load custom function to get weights.
net.c <- readRDS("input_data/stool.net.rds")
class(net.c)
## [1] "select"Add names to IDs
We also add abundance values to vertex (nodes).
colnames(n.c) <- rownames(n.c) <- colnames(otu.c)

vsize <- log2(apply(otu.c, 2, mean)) # add log abundance as properties of vertex/nodes.
9.2.1 Prepare data for plotting
stool.ig <- graph.adjacency(n.c, mode='undirected', add.rownames = TRUE, weighted = TRUE)
stool.ig # we can see all the attributes and weights
## IGRAPH a8db9f0 UNW- 679 2454 --
## + attr: name (v/c), TRUE (v/c), weight (e/n)
## + edges from a8db9f0 (vertex names):
## [1] OTU-9410491526:Bacteroides--OTU-9410491516:Bacteroides
## [2] OTU-9410491526:Bacteroides--OTU-9410491518:Bacteroides
## [3] OTU-9410491526:Bacteroides--OTU-941049327:Bacteroides
## [4] OTU-9410491526:Bacteroides--OTU-941049949:Bacteroides
## [5] OTU-9410491526:Bacteroides--OTU-9410491514:Bacteroides
## [6] OTU-9410491526:Bacteroides--OTU-9410491513:Bacteroides
## [7] OTU-9410491526:Bacteroides--OTU-9410491574:Parasutterella
## [8] OTU-9410491516:Bacteroides--OTU-9410491522:Bacteroides
## + ... omitted several edgesset the layout option
9.2.2 igraph network
E(stool.ig)[weight > 0]$color<-"steelblue" #now color the edges based on their values positive is steelblue
E(stool.ig)[weight < 0]$color<-"orange"  #now color the edges based on their values

plot(stool.ig, layout=coords.fdr, vertex.size = 2, vertex.label.cex = 0.5)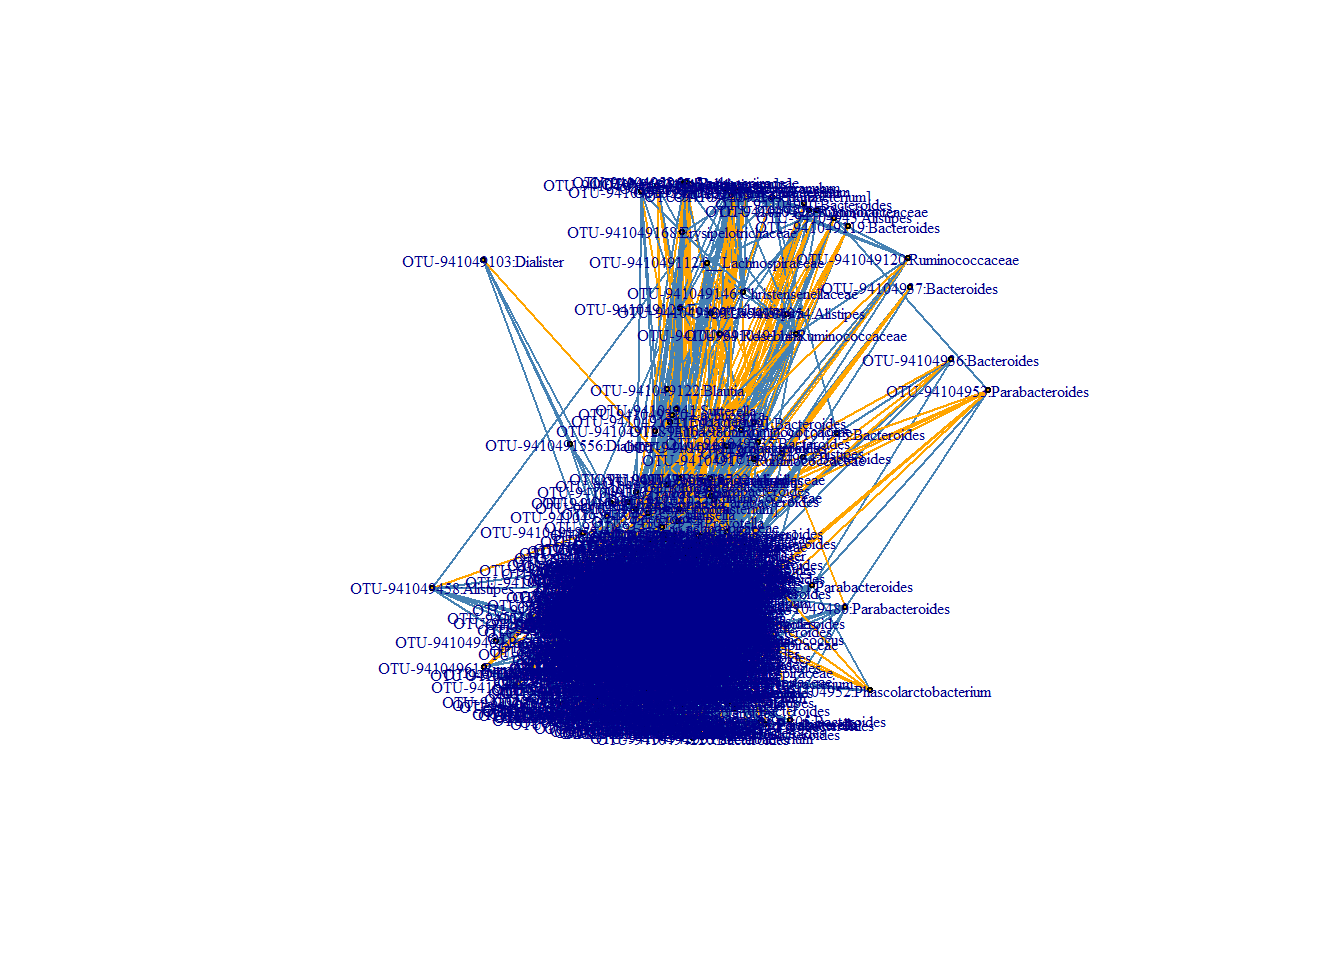
The visualisation can be enhanced using ggnet R package.
stool.net <- asNetwork(stool.ig)
network::set.edge.attribute(stool.net, "color", ifelse(stool.net %e% "weight" > 0, "steelblue", "orange"))
Start adding taxonomic information.
## [1] "Domain" "Phylum" "Class" "Order" "Family" "Genus" "best_hit"9.2.3 Network plot
mycolors <- scale_color_manual(values = c("#a6cee3", "#1f78b4", "#b2df8a", "#33a02c","#fb9a99","#e31a1c","#fdbf6f","#ff7f00","#cab2d6","#6a3d9a","#ffff99","#b15928"))

p <- ggnet2(stool.net, node.color = "Phylum",
            label = TRUE, node.size = "nodesize",
            label.size = 2, edge.color = "color") + guides(color=guide_legend(title="Phylum"), size = FALSE) + mycolors

p 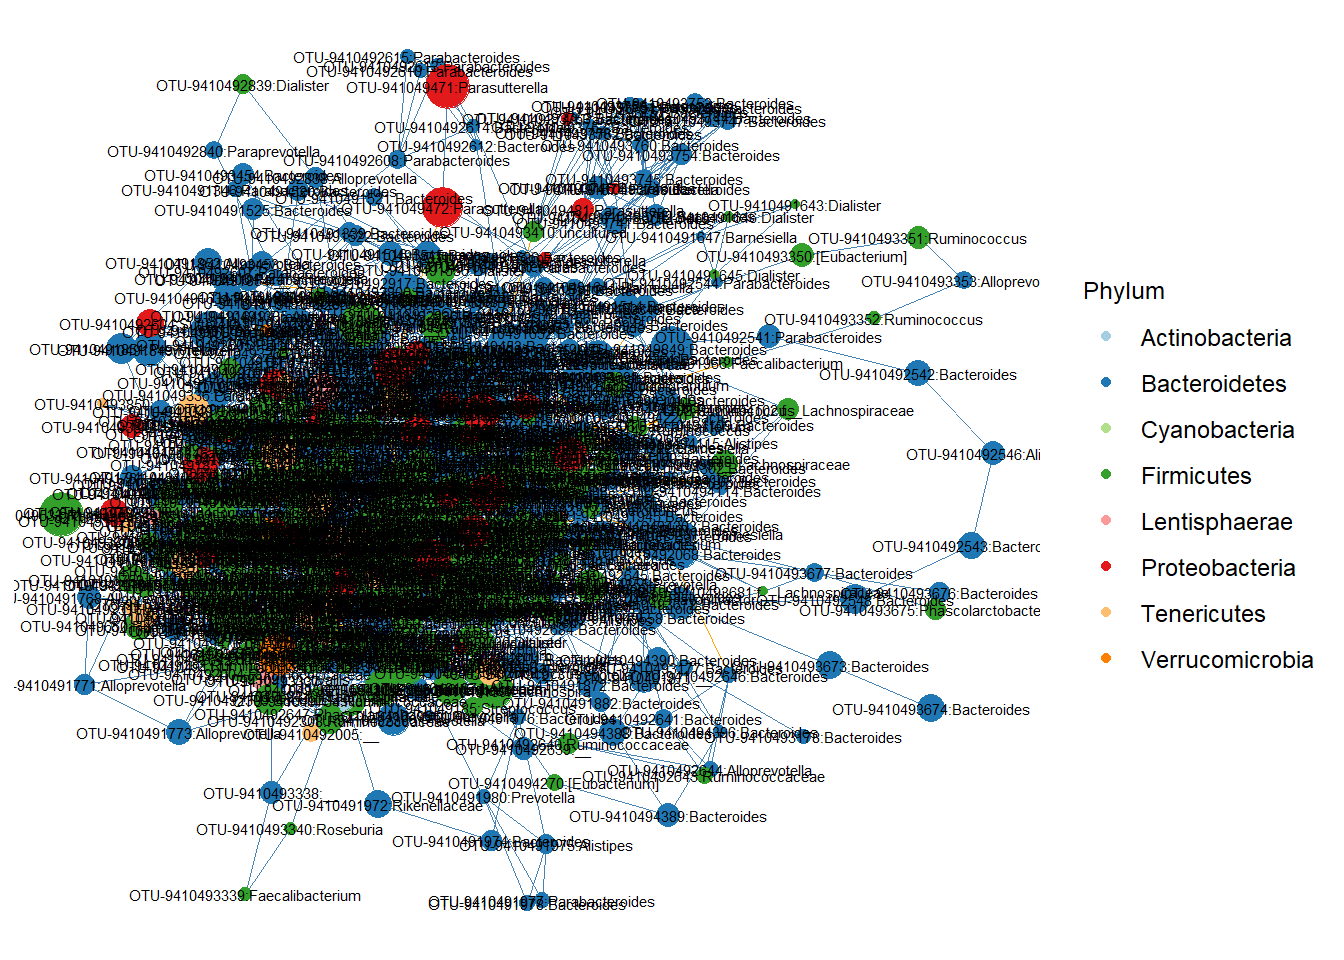
This is difficult to interpret. One way is to remove nodes that are connected to few other nodes. We can use degree as a network statisitic.
stl.mb <- degree.distribution(stool.ig)
plot(0:(length(stl.mb)-1), stl.mb, ylim=c(0,.35), type='b',
      ylab="Frequency", xlab="Degree", main="Degree Distributions")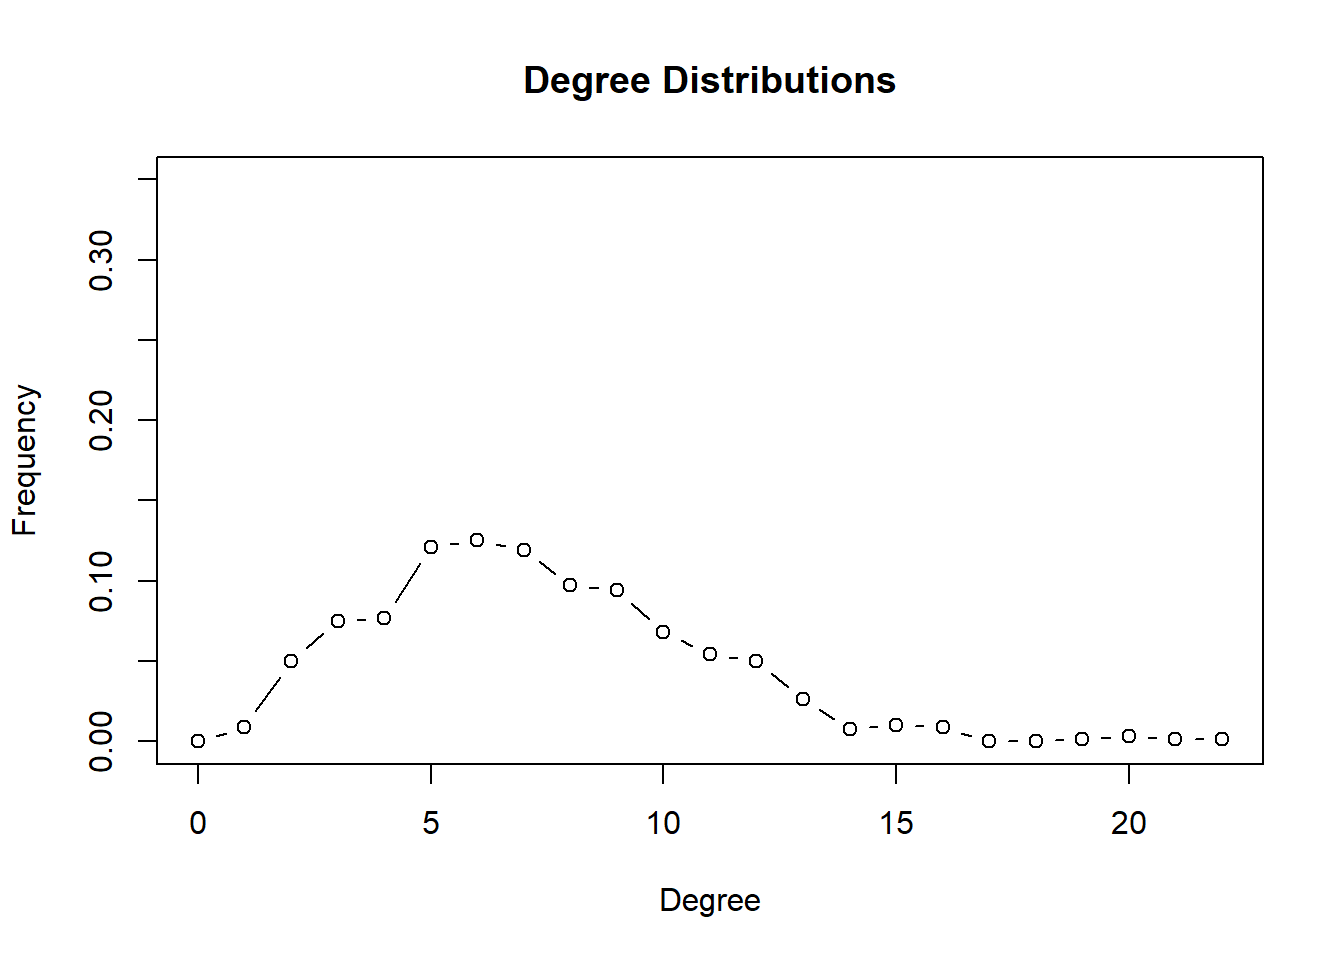
# we will look at only taxa connect more than 10 others
p <- ggnet2(stool.net, node.color = "Phylum",
            label = TRUE,
            label.size = 3, edge.color = "color",
            size = "degree", size.min = 10) + guides(color=guide_legend(title="Phylum"), size = FALSE) + mycolors
## size.min removed 521 nodes out of 679## Scale for 'colour' is already present. Adding another scale for 'colour',
## which will replace the existing scale.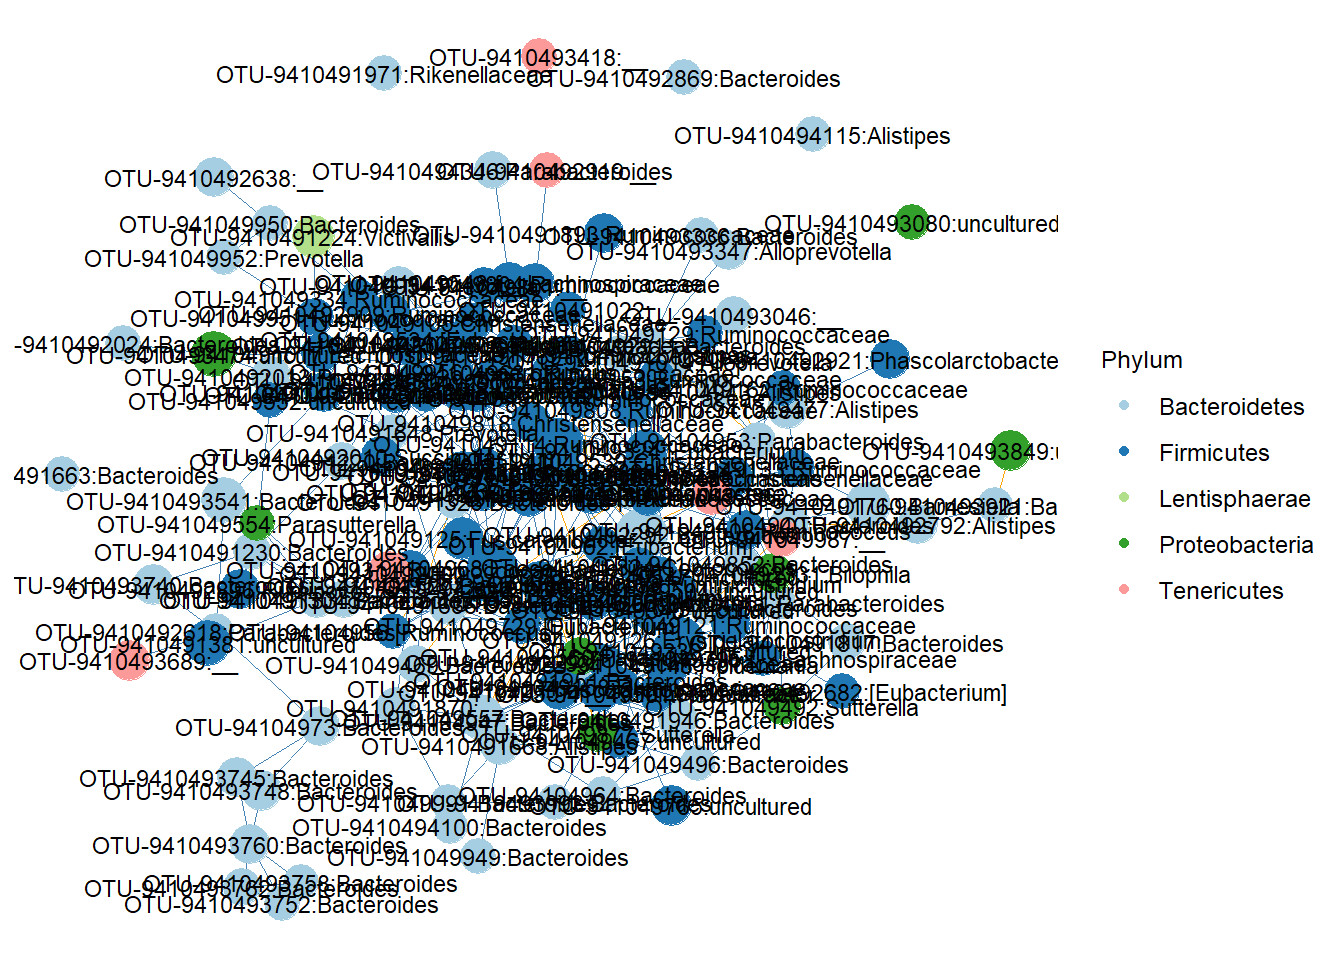
9.3 Network properties
Check for the number of positive and negative edges.
betaMat=as.matrix(symBeta(getOptBeta(net.c)))

# We divide by two since an edge is represented by two entries in the matrix.
positive=length(betaMat[betaMat>0])/2

negative=length(betaMat[betaMat<0])/2

total=length(betaMat[betaMat!=0])/2
9.3.1 Modularity in networks
## Model: Meinshausen & Buhlmann Graph Estimation (mb)
## selection criterion: stars
## Graph dimension: 679
## sparsity level 0.01066118
mod.net <- net.c$refit
colnames(mod.net) <- rownames(mod.net) <- colnames(otu.c)#you can remove this
vsize <- log2(apply(otu.c, 2, mean))# value we may or may not use as vertex.attribute
stool.ig.mod <- graph.adjacency(mod.net, mode='undirected', add.rownames = TRUE)
plot(stool.ig.mod) # we can see all the attributes and weights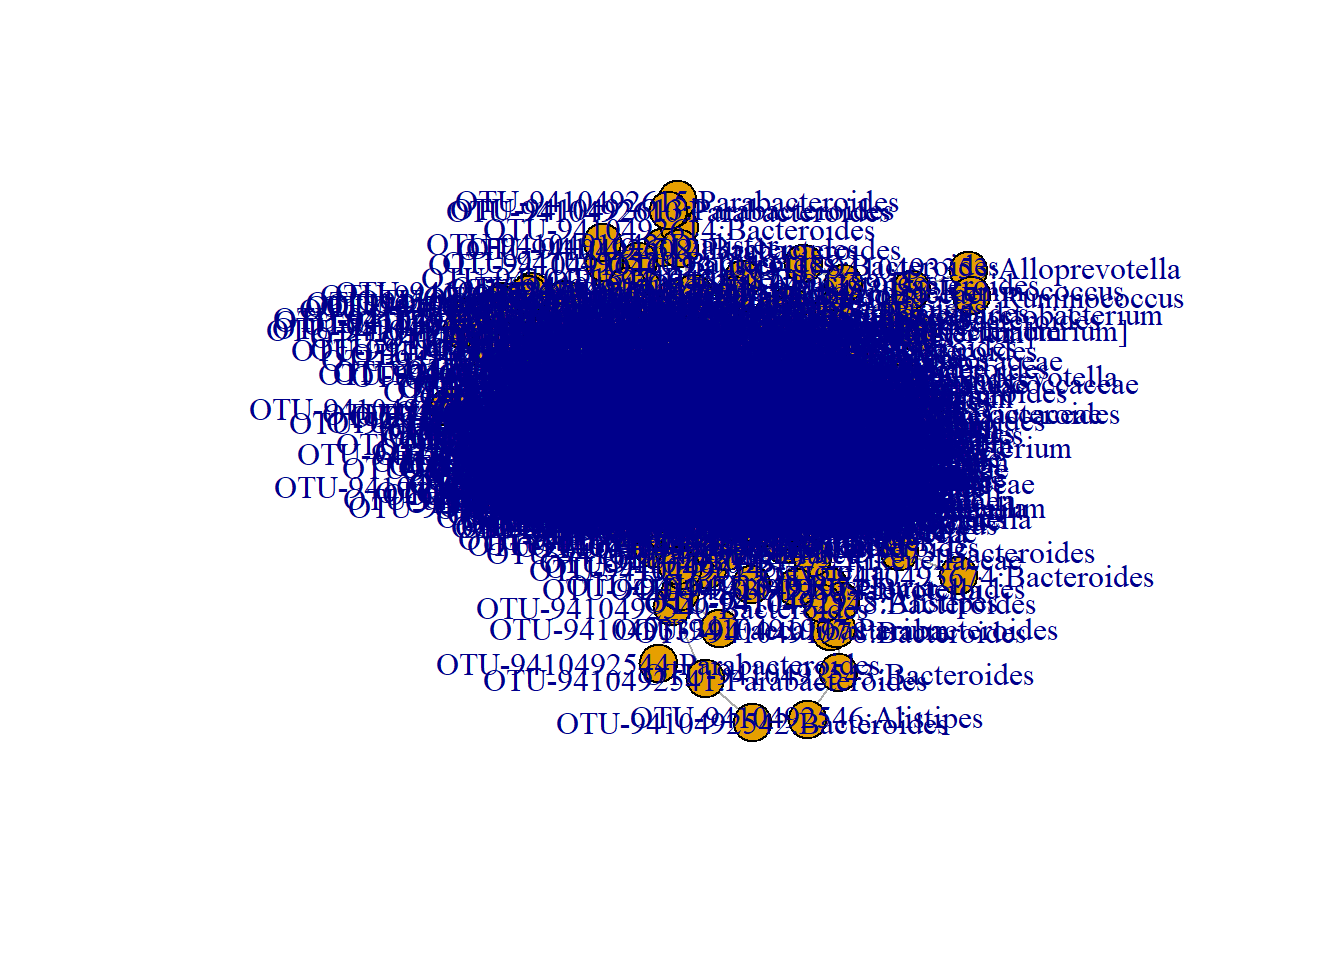
Set vertex attributes. We can color by phyla and set the size of nodes based on log2 abundance.
9.3.2 Network plot
mycolors <- scale_color_manual(values = c("#a6cee3", "#1f78b4", "#b2df8a", "#33a02c","#fb9a99","#e31a1c","#fdbf6f","#ff7f00","#cab2d6","#6a3d9a","#ffff99","#b15928"))

# check the colorpicker in the addins option in RStudio to interactively select color options.

p <- ggnet2(stool.net.mod, node.color = "Phylum",
            label = TRUE, node.size = 2,
            label.size = 2) + guides(color=guide_legend(title="Phylum"), size = FALSE) + mycolors

p 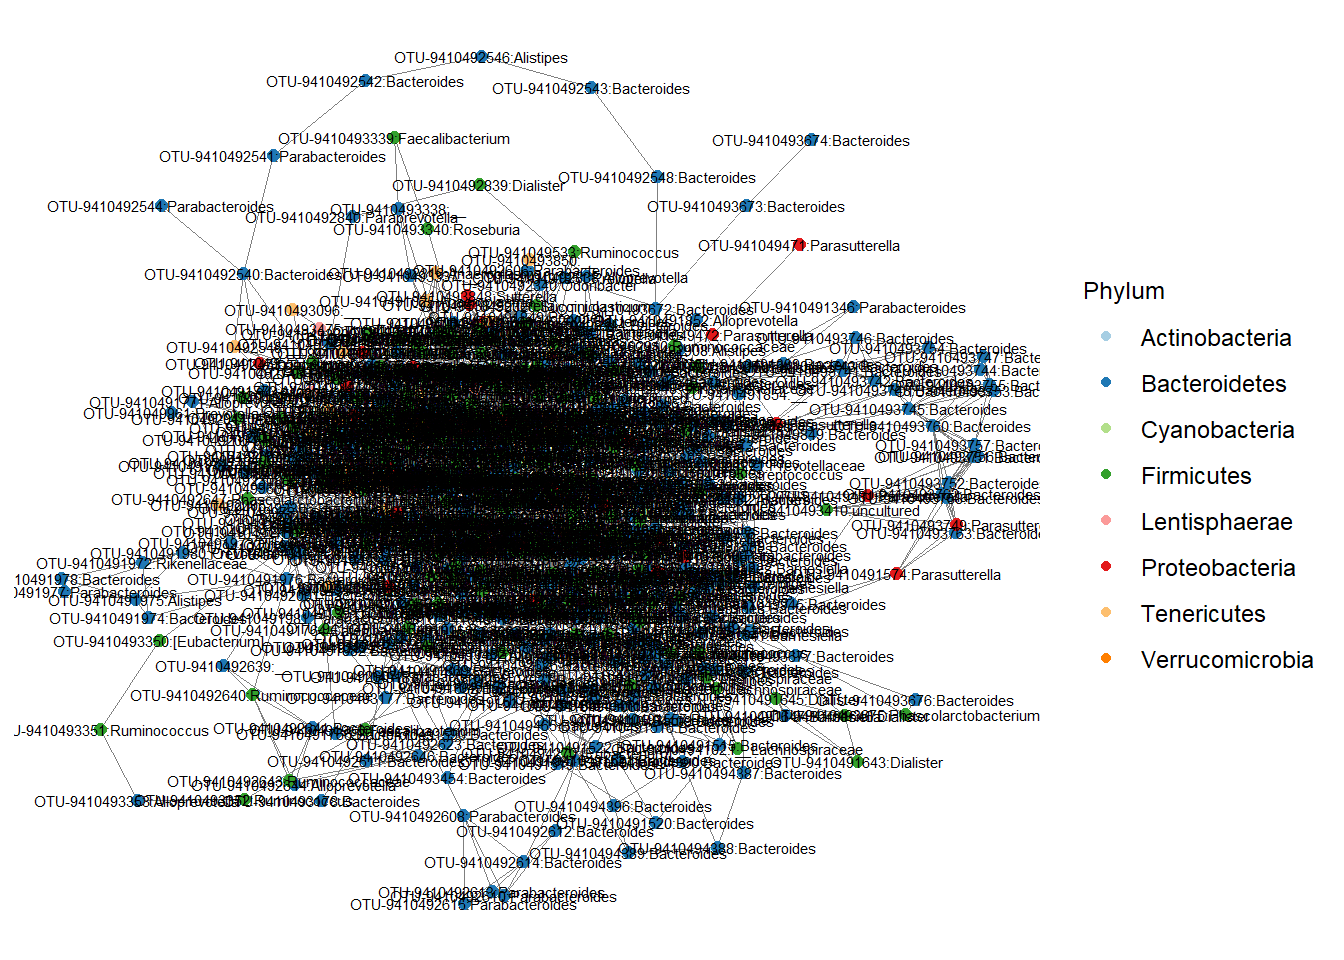
Identify modularity in networks.
## IGRAPH clustering fast greedy, groups: 12, mod: 0.47
## + groups:
##   $`1`
##    [1] "OTU-9410492646:Bacteroides"
##    [2] "OTU-9410492641:Bacteroides"
##    [3] "OTU-9410492645:Bacteroides"
##    [4] "OTU-9410491981:Parabacteroides"
##    [5] "OTU-9410491974:Bacteroides"
##    [6] "OTU-9410491978:Bacteroides"
##    [7] "OTU-9410491977:Parabacteroides"
##    [8] "OTU-9410491976:Bacteroides"
##    [9] "OTU-9410492922:Bacteroides"
## + ... omitted several groups/vertices## [1] 0.4725467V(stool.ig.mod)$color=modules$membership
plot(stool.ig.mod, col = modules, vertex.size = 4, vertex.label = NA)
stool.net.mod %v% "membership" <- modules$membership

p <- ggnet2(stool.net.mod, node.color = "membership",
            label = TRUE, node.size = "nodesize",
            label.size = 2) + guides(color=guide_legend(title="membership"), size = FALSE) + mycolors
## Scale for 'colour' is already present. Adding another scale for 'colour',
## which will replace the existing scale.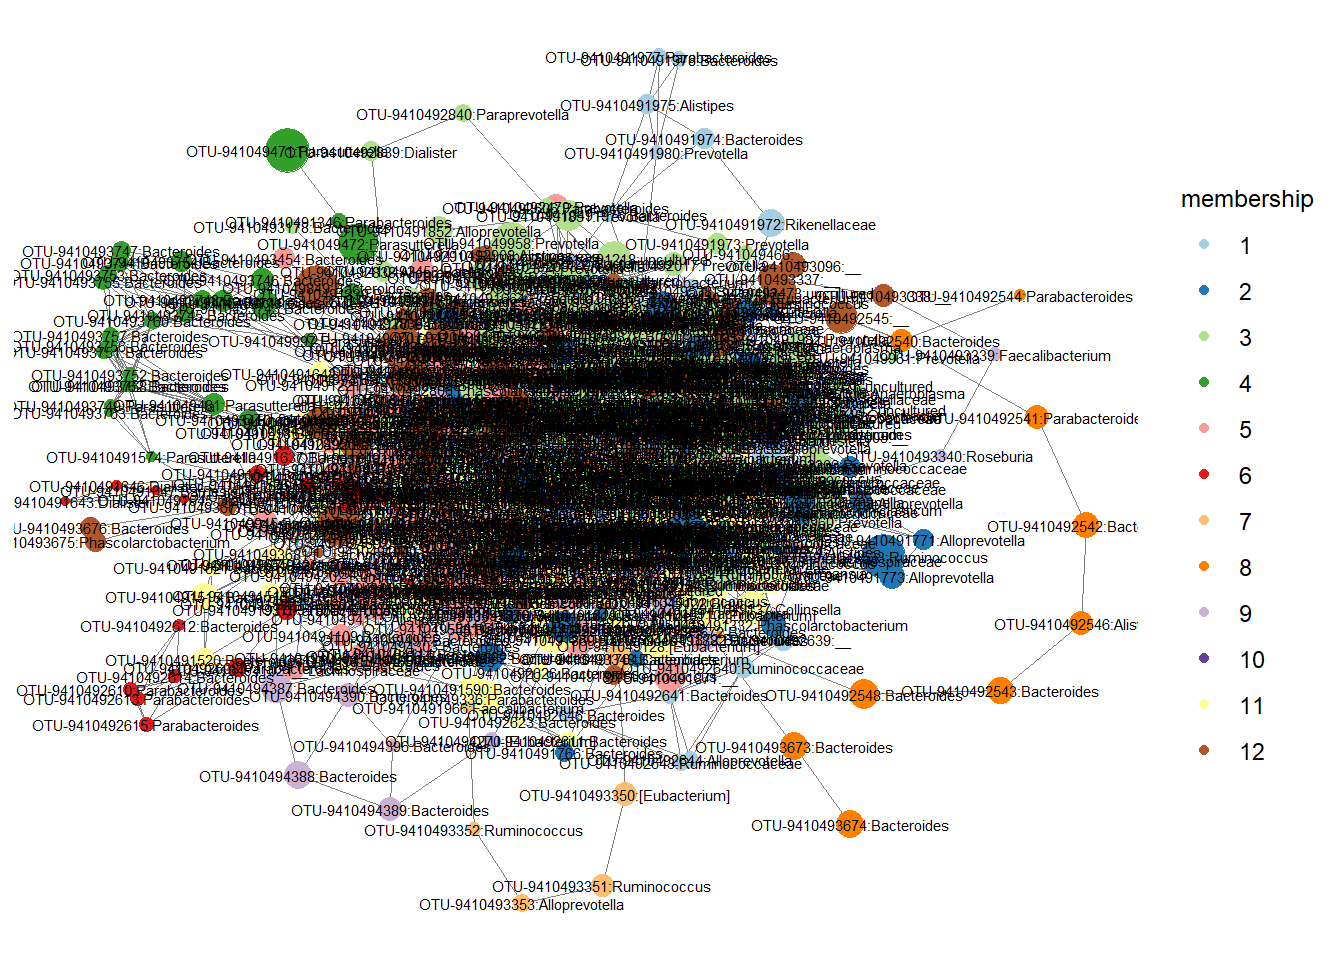
Check which OTUs are part of different modules.
modulesOneIndices=which(modules$membership==1)
modulesOneOtus=modules$names[modulesOneIndices]
modulesTwoIndices=which(modules$membership==2)
modulesTwoOtus=modules$names[modulesTwoIndices]

modulesThreeIndices=which(modules$membership==3)
modulesThreeOtus=modules$names[modulesThreeIndices]
modulesFourIndices=which(modules$membership==4)
modulesFourOtus=modules$names[modulesFourIndices]

modulesFiveIndices=which(modules$membership==5)
modulesFiveOtus=modules$names[modulesFiveIndices]
modulesSixIndices=which(modules$membership==6)
modulesSixOtus=modules$names[modulesSixIndices]

print(modulesOneOtus)
## [1] "OTU-9410492646:Bacteroides"
## [2] "OTU-9410492641:Bacteroides"
## [3] "OTU-9410492645:Bacteroides"
## [4] "OTU-9410491981:Parabacteroides"
## [5] "OTU-9410491974:Bacteroides"
## [6] "OTU-9410491978:Bacteroides"
## [7] "OTU-9410491977:Parabacteroides"
## [8] "OTU-9410491976:Bacteroides"
## [9] "OTU-9410492922:Bacteroides"
## [10] "OTU-9410492638:__"
## [11] "OTU-9410492639:__"
## [12] "OTU-941049940:Butyricimonas"
## [13] "OTU-9410491975:Alistipes"
## [14] "OTU-9410491971:Rikenellaceae"
## [15] "OTU-9410491972:Rikenellaceae"
## [16] "OTU-9410492644:Alloprevotella"
## [17] "OTU-9410491758:Alloprevotella"
## [18] "OTU-9410491980:Prevotella"
## [19] "OTU-9410492643:Ruminococcaceae"
## [20] "OTU-9410492640:Ruminococcaceae"
## [21] "OTU-9410492921:Phascolarctobacterium"
## [22] "OTU-9410492647:Phascolarctobacterium"
## [23] "OTU-941049538:Sutterella"
## [24] "OTU-941049552:uncultured"
## [25] "OTU-9410492642:uncultured"9.3.3 Good reads for ecological networks
Using network analysis to explore co-occurrence patterns in soil microbial communities
Microbial Co-occurrence Relationships in the Human Microbiome
Correlation detection strategies in microbial data sets vary widely in sensitivity and precision
## R version 3.6.3 (2020-02-29)
## Platform: x86_64-w64-mingw32/x64 (64-bit)
## Running under: Windows 10 x64 (build 18363)
##
## Matrix products: default
##
## locale:
## [1] LC_COLLATE=English_Netherlands.1252  LC_CTYPE=English_Netherlands.1252
## [3] LC_MONETARY=English_Netherlands.1252 LC_NUMERIC=C
## [5] LC_TIME=English_Netherlands.1252
##
## attached base packages:
## [1] stats     graphics  grDevices utils     datasets  methods   base
##
## other attached packages:
##  [1] scales_1.1.0         sna_2.5              statnet.common_4.3.0
##  [4] igraph_1.2.4.2       ggnet_0.1.0          intergraph_2.0-2
##  [7] network_1.16.0       SpiecEasi_1.0.7      dplyr_0.8.5
## [10] ggpubr_0.2.5         magrittr_1.5         RColorBrewer_1.1-2
## [13] microbiome_1.8.0     ggplot2_3.3.0        phyloseq_1.30.0
##
## loaded via a namespace (and not attached):
##  [1] viridis_0.5.1               Biobase_2.46.0
##  [3] tidyr_1.0.2                 viridisLite_0.3.0
##  [5] VGAM_1.1-2                  jsonlite_1.6.1
##  [7] splines_3.6.3               foreach_1.4.8
##  [9] assertthat_0.2.1            stats4_3.6.3
## [11] yaml_2.2.1                  ggrepel_0.8.2
## [13] pillar_1.4.3                lattice_0.20-40
## [15] glue_1.3.2                  digest_0.6.25
## [17] ggsignif_0.6.0              XVector_0.26.0
## [19] colorspace_1.4-1            htmltools_0.4.0
## [21] Matrix_1.2-18               plyr_1.8.6
## [23] microbiomeutilities_0.99.02 pkgconfig_2.0.3
## [25] pheatmap_1.0.12             pulsar_0.3.6
## [27] bookdown_0.18               zlibbioc_1.32.0
## [29] purrr_0.3.3                 Rtsne_0.15
## [31] huge_1.3.4                  tibble_2.1.3
## [33] mgcv_1.8-31                 farver_2.0.3
## [35] IRanges_2.20.2              ellipsis_0.3.0
## [37] withr_2.1.2                 BiocGenerics_0.32.0
## [39] survival_3.1-11             crayon_1.3.4
## [41] evaluate_0.14               nlme_3.1-145
## [43] MASS_7.3-51.5               vegan_2.5-6
## [45] tools_3.6.3                 data.table_1.12.8
## [47] formatR_1.7                 lifecycle_0.2.0
## [49] stringr_1.4.0               Rhdf5lib_1.8.0
## [51] S4Vectors_0.24.3            munsell_0.5.0
## [53] cluster_2.1.0               Biostrings_2.54.0
## [55] ade4_1.7-15                 compiler_3.6.3
## [57] rlang_0.4.5                 rhdf5_2.30.1
## [59] grid_3.6.3                  iterators_1.0.12
## [61] biomformat_1.14.0           rmarkdown_2.1
## [63] gtable_0.3.0                codetools_0.2-16
## [65] multtest_2.42.0             reshape2_1.4.3
## [67] R6_2.4.1                    gridExtra_2.3
## [69] knitr_1.28                  permute_0.9-5
## [71] ape_5.3                     stringi_1.4.6
## [73] parallel_3.6.3              Rcpp_1.0.4
## [75] vctrs_0.2.4                 coda_0.19-3
## [77] tidyselect_1.0.0            xfun_0.12