6 Composition plots
Barplots are a one way of visualising the composition of your samples.
We will use the filtered phyloseq object from Set-up and Pre-processing section.
Load packages
library(microbiome) # data analysis and visualisation
library(phyloseq) # also the basis of data object. Data analysis and visualisation
library(RColorBrewer) # nice color options
library(ggpubr) # publication quality figures, based on ggplot2
library(dplyr) # data handling
ps1 <- readRDS("./phyobjects/ps.ng.tax.rds")
# use print option to see the data saved as phyloseq object.
print(ps1)## phyloseq-class experiment-level object
## otu_table() OTU Table: [ 4710 taxa and 474 samples ]
## sample_data() Sample Data: [ 474 samples by 30 sample variables ]
## tax_table() Taxonomy Table: [ 4710 taxa by 6 taxonomic ranks ]
## phy_tree() Phylogenetic Tree: [ 4710 tips and 4709 internal nodes ]6.1 Barplot counts
ps1.com <- ps1

# if you have dada2/deblur output and sequences as taxa names, then you can change them as follows
taxa_names(ps1.com) <- paste0("ASV_", rownames(tax_table(ps1.com)))

# We need to set Palette
taxic <- as.data.frame(ps1.com@tax_table) # this will help in setting large color options

# colourCount = length(unique(taxic$Family))  #define number of variable colors based on number of Family (change the level accordingly to phylum/class/order)
# getPalette = colorRampPalette(brewer.pal(12, "Paired"))  # change the palette as well as the number of colors will change according to palette.

taxic$OTU <- rownames(taxic) # Add the OTU ids from OTU table into the taxa table at the end.
colnames(taxic) # You can see that we now have extra taxonomy levels.
## [1] "Domain" "Phylum" "Class" "Order" "Family" "Genus" "OTU"taxmat <- as.matrix(taxic) # convert it into a matrix.
new.tax <- tax_table(taxmat) # convert into phyloseq compatible file.
tax_table(ps1.com) <- new.tax # incroporate into phyloseq Object
# now edit the unclassified taxa
tax_table(ps1.com)[tax_table(ps1.com)[, "Family"] == "", "Family"] <- "Unclassified family"
# it would be nice to have the Taxonomic names in italics.
# for that we set this
guide_italics <- guides(fill = guide_legend(label.theme = element_text(
size = 15,
face = "italic", colour = "Black", angle = 0
)))
## Now we need to plot at family level, we can do it as follows:
# first remove the phy_tree
ps1.com@phy_tree <- NULL
# Second merge at family level
ps1.com.fam <- microbiome::aggregate_top_taxa(ps1.com, "Family", top = 10)
plot.composition.COuntAbun <- plot_composition(ps1.com.fam) + theme(legend.position = "bottom") +
scale_fill_brewer("Family", palette = "Paired") + theme_bw() +
theme(axis.text.x = element_text(angle = 90)) +
ggtitle("Relative abundance") + guide_italics + theme(legend.title = element_text(size = 18))
plot.composition.COuntAbun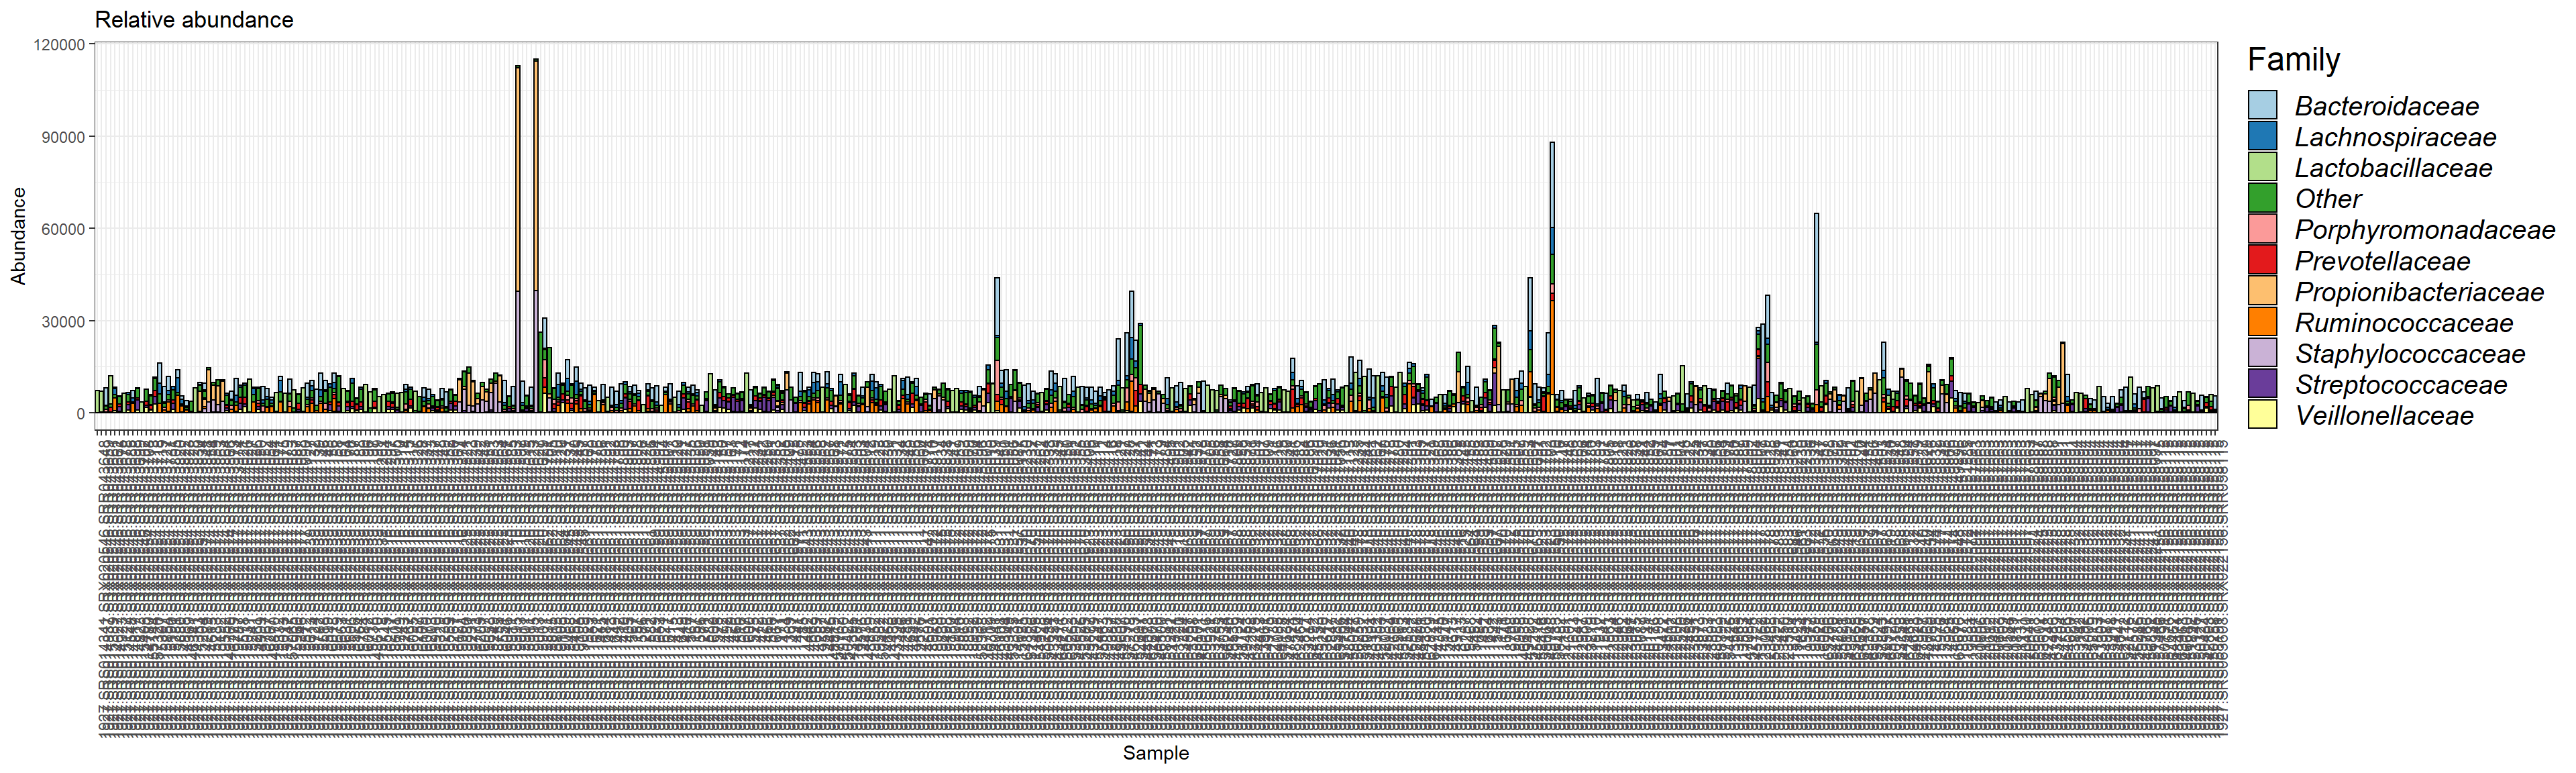
This plot is based on the reads per sample. In the next step, we plot the relative abundance.
6.2 Barplot relative abundance
Make it relative abundance
# the previous pseq object ps1.com.fam is only counts.

# Use traqnsform function of microbiome to convert it to rel abun.
ps1.com.fam.rel <- microbiome::transform(ps1.com.fam, "compositional")

plot.composition.relAbun <- plot_composition(ps1.com.fam.rel,
                                             sample.sort = "scientific_name",
                                             x.label = "env_material")
plot.composition.relAbun <- plot.composition.relAbun + theme(legend.position = "bottom")
plot.composition.relAbun <- plot.composition.relAbun + scale_fill_brewer("Family", palette = "Paired") + theme_bw()
plot.composition.relAbun <- plot.composition.relAbun + theme(axis.text.x = element_text(angle = 90))
plot.composition.relAbun <- plot.composition.relAbun + ggtitle("Relative abundance") + guide_italics + theme(legend.title = element_text(size = 18))

print(plot.composition.relAbun)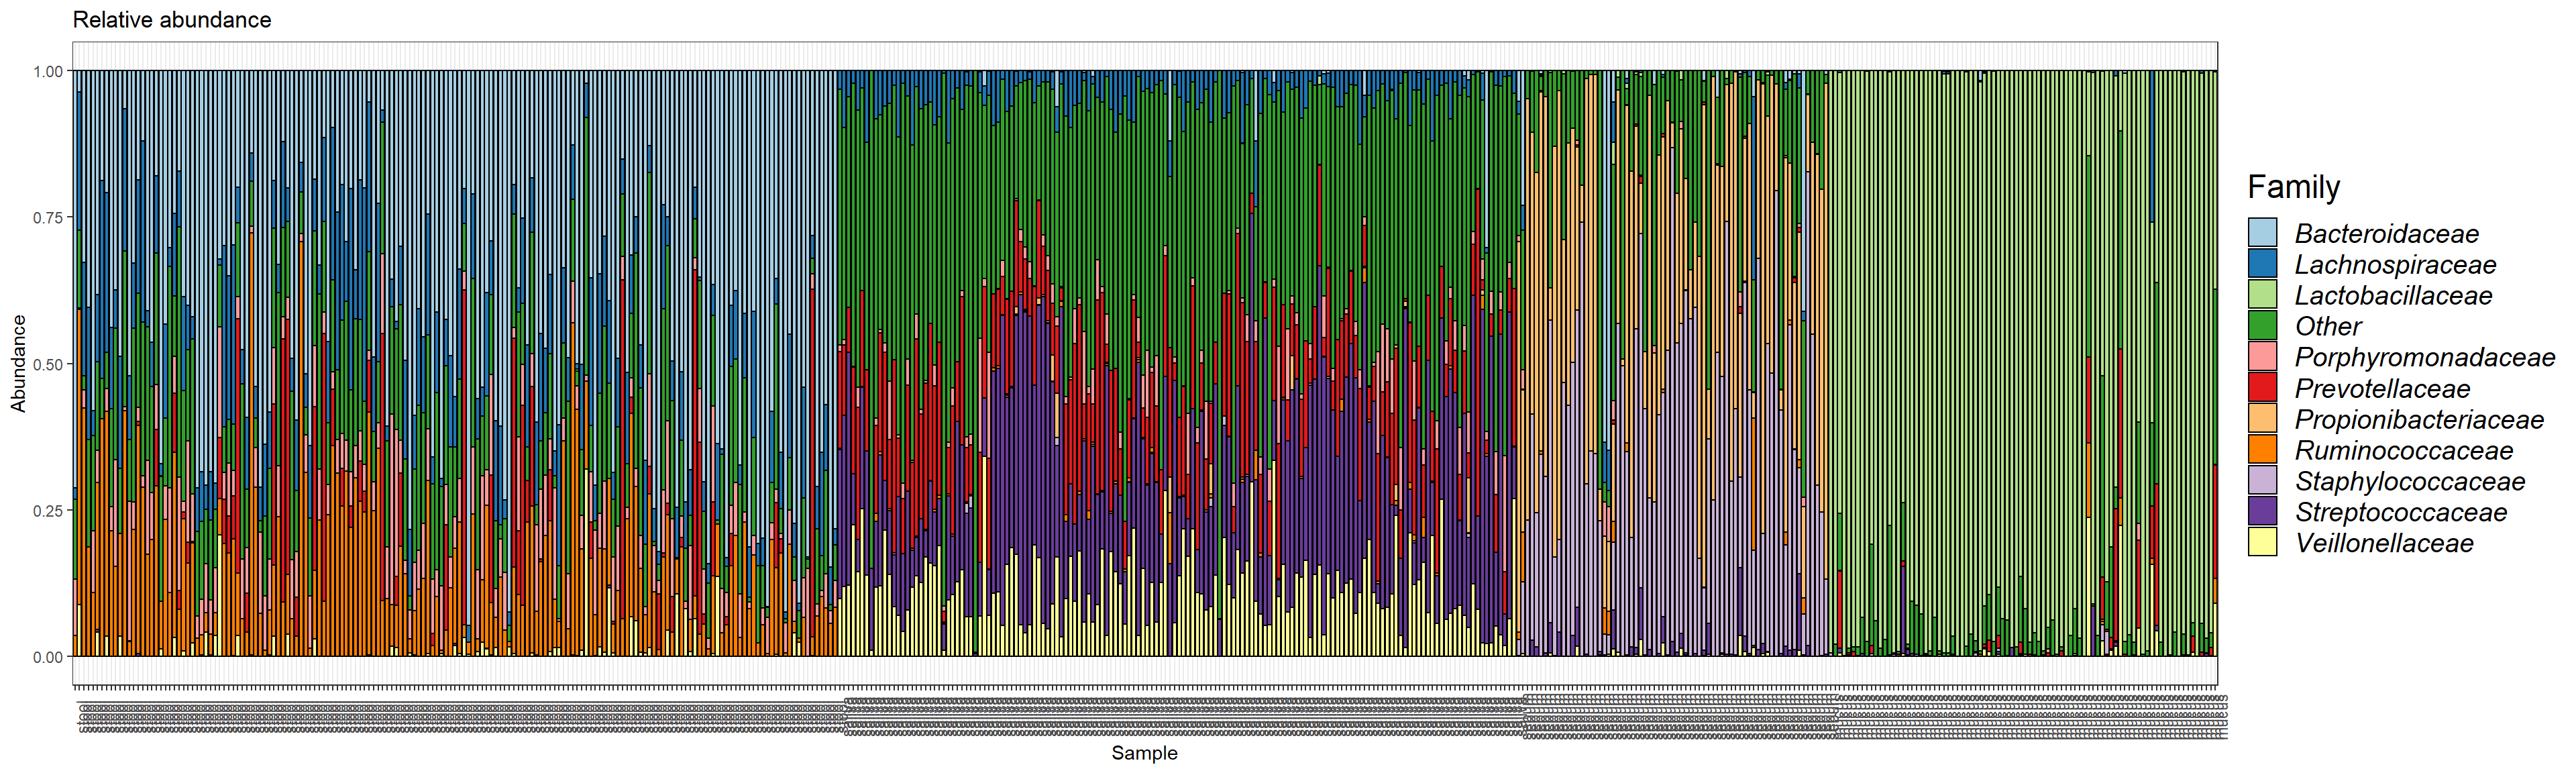
6.2.1 Barplot customize
## [1] "Tax" "Sample" "Abundance" "xlabel"p.com <- ggplot(data.com, aes(x = Sample, y = Abundance, fill = Tax))
p.com <- p.com + geom_bar(position = "stack", stat = "identity")
p.com <- p.com + scale_x_discrete(labels = data.com$xlabel, breaks = data.com$Sample)
p.com <- p.com + facet_grid(~xlabel, scales = "free") + theme_bw()
p.com <- p.com + scale_fill_brewer("Family", palette = "Paired")
p.com <- p.com + rremove("x.text")
ggsave("./figures/Composition plots.pdf", height = 4, width = 6)For more information Microbiome tutorial
6.3 Heatmaps
These are a good alternative to barplots (if done right).
# base plot
p.heat <- ggplot(data.com, aes(x = Sample, y = Tax)) + geom_tile(aes(fill = Abundance))

# Change color
p.heat <- p.heat + scale_fill_distiller("Abundance", palette = "RdYlBu") + theme_bw()

# Make bacterial names italics
p.heat <- p.heat + theme(axis.text.y = element_text(colour = 'black',
                                                    size = 10,
                                                    face = 'italic'))
# Make seperate samples based on main varaible
p.heat <- p.heat + facet_grid(~xlabel,
                              scales = "free") + rremove("x.text")

p.heat <- p.heat + ylab("Family")

#Clean the x-axis
p.heat <- p.heat + theme(axis.title.x=element_blank(),
                     axis.text.x=element_blank(),
                     axis.ticks.x=element_blank())

# Clean the facet label box
p.heat <- p.heat + theme(legend.key = element_blank(),
                     strip.background = element_rect(colour="black", fill="white"))

print(p.heat)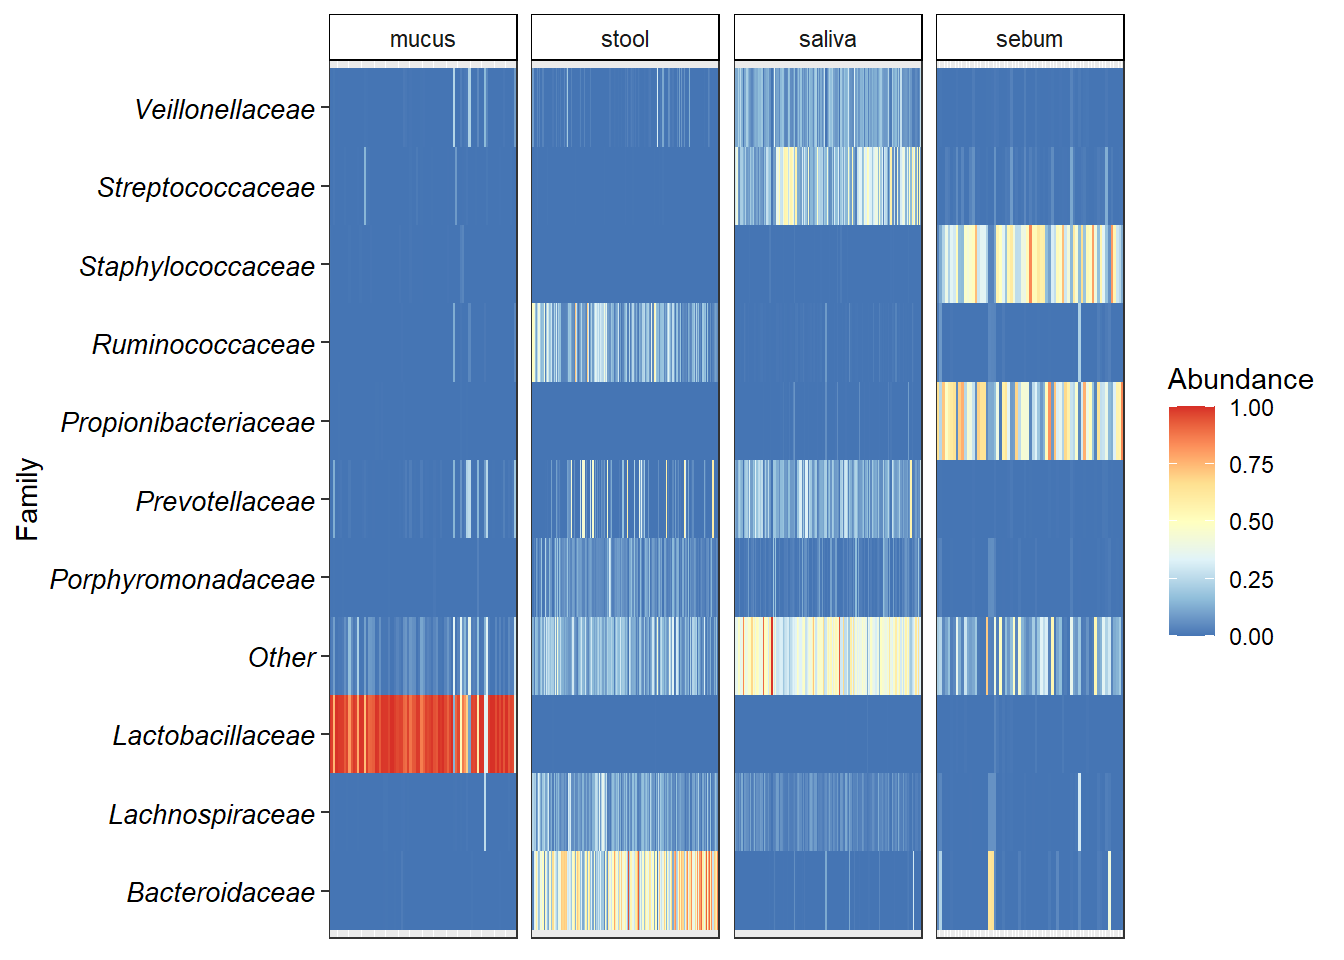
ggsave("./figures/Heatmap.pdf", height = 4, width = 6)


# + geom_text(aes(label = round(Abundance)), size = 0.4)
Extra
Following is an example of customizing the plot using ggpubr.
# we use count data at family level from the barplot for counts
ps_df <- microbiomeutilities::phy_to_ldf(ps1.com.fam,
                                         transform.counts = "compositional")
## Warning: replacing previous import 'ggplot2::alpha' by 'microbiome::alpha' when
## loading 'microbiomeutilities'## An additonal column Sam_rep with sample names is created for reference purpose## [1] "OTUID" "Family"
## [3] "unique" "Sam_rep"
## [5] "Abundance" "BarcodeSequence"
## [7] "LinkerPrimerSequence" "run_prefix"
## [9] "body_habitat" "body_product"
## [11] "body_site" "bodysite"
## [13] "dna_extracted" "elevation"
## [15] "env" "env_biome"
## [17] "env_feature" "env_material"
## [19] "env_package" "geo_loc_name"
## [21] "host_common_name" "host_scientific_name"
## [23] "host_subject_id" "host_taxid"
## [25] "latitude" "longitude"
## [27] "physical_specimen_location" "physical_specimen_remaining"
## [29] "psn" "public"
## [31] "sample_type" "scientific_name"
## [33] "sequencecenter" "title"
## [35] "Description"# this data.frame can be used to customize several plots.
# example boxplot at family level
p.box <- ggstripchart(ps_df, "scientific_name", "Abundance",
facet.by = "Family", color = "body_product",
palette = "jco"
)
p.box + rremove("x.text")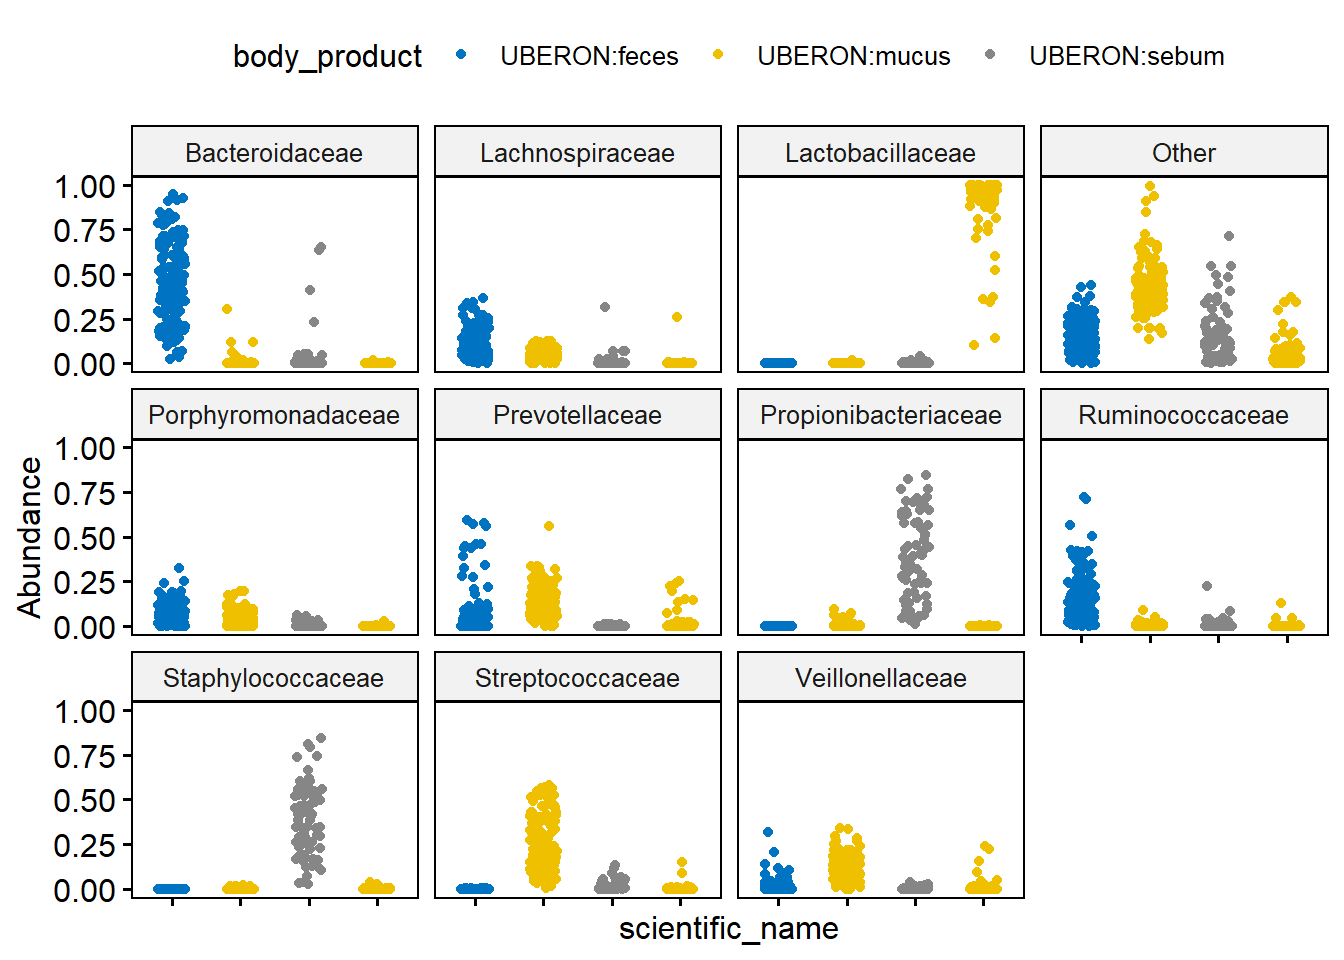
## R version 3.6.3 (2020-02-29)
## Platform: x86_64-w64-mingw32/x64 (64-bit)
## Running under: Windows 10 x64 (build 18363)
##
## Matrix products: default
##
## locale:
## [1] LC_COLLATE=English_Netherlands.1252  LC_CTYPE=English_Netherlands.1252
## [3] LC_MONETARY=English_Netherlands.1252 LC_NUMERIC=C
## [5] LC_TIME=English_Netherlands.1252
##
## attached base packages:
## [1] stats     graphics  grDevices utils     datasets  methods   base
##
## other attached packages:
## [1] dplyr_0.8.5        ggpubr_0.2.5       magrittr_1.5       RColorBrewer_1.1-2
## [5] microbiome_1.8.0   ggplot2_3.3.0      phyloseq_1.30.0
##
## loaded via a namespace (and not attached):
##  [1] ggrepel_0.8.2               Rcpp_1.0.4
##  [3] ape_5.3                     lattice_0.20-40
##  [5] tidyr_1.0.2                 Biostrings_2.54.0
##  [7] assertthat_0.2.1            digest_0.6.25
##  [9] foreach_1.4.8               R6_2.4.1
## [11] plyr_1.8.6                  stats4_3.6.3
## [13] evaluate_0.14               pillar_1.4.3
## [15] zlibbioc_1.32.0             rlang_0.4.5
## [17] data.table_1.12.8           vegan_2.5-6
## [19] S4Vectors_0.24.3            Matrix_1.2-18
## [21] rmarkdown_2.1               labeling_0.3
## [23] splines_3.6.3               Rtsne_0.15
## [25] stringr_1.4.0               pheatmap_1.0.12
## [27] igraph_1.2.4.2              munsell_0.5.0
## [29] compiler_3.6.3              xfun_0.12
## [31] pkgconfig_2.0.3             BiocGenerics_0.32.0
## [33] multtest_2.42.0             mgcv_1.8-31
## [35] htmltools_0.4.0             biomformat_1.14.0
## [37] tidyselect_1.0.0            gridExtra_2.3
## [39] tibble_2.1.3                bookdown_0.18
## [41] IRanges_2.20.2              codetools_0.2-16
## [43] viridisLite_0.3.0           permute_0.9-5
## [45] crayon_1.3.4                withr_2.1.2
## [47] MASS_7.3-51.5               grid_3.6.3
## [49] nlme_3.1-145                jsonlite_1.6.1
## [51] gtable_0.3.0                lifecycle_0.2.0
## [53] scales_1.1.0                stringi_1.4.6
## [55] farver_2.0.3                XVector_0.26.0
## [57] ggsignif_0.6.0              reshape2_1.4.3
## [59] viridis_0.5.1               ellipsis_0.3.0
## [61] vctrs_0.2.4                 ggsci_2.9
## [63] Rhdf5lib_1.8.0              iterators_1.0.12
## [65] tools_3.6.3                 microbiomeutilities_0.99.02
## [67] ade4_1.7-15                 Biobase_2.46.0
## [69] glue_1.3.2                  purrr_0.3.3
## [71] parallel_3.6.3              survival_3.1-11
## [73] yaml_2.2.1                  colorspace_1.4-1
## [75] rhdf5_2.30.1                cluster_2.1.0
## [77] knitr_1.28