8 Core microbiota
For more information:
The adult intestinal core microbiota is determined by analysis depth and health status.
library(microbiome) # data analysis and visualisation
library(phyloseq) # also the basis of data object. Data analysis and visualisation
library(RColorBrewer) # nice color options
library(ggpubr) # publication quality figures, based on ggplot2
library(dplyr) # data handling
8.1 Core microbiota anlaysis
We will use the filtered phyloseq object from previous tutorial. We will use the filtered phyloseq object from the first section for pre-processioning.
# read non rarefied data
ps1 <- readRDS("./phyobjects/ps.ng.tax.rds")

# use print option to see the data saved as phyloseq object.
Subset the data to keep only stool samples.
ps1.stool <- subset_samples(ps1, bodysite == "Stool")

# convert to relative abundance
ps1.stool.rel <- microbiome::transform(ps1.stool, "compositional")
print(ps1.stool.rel)
## phyloseq-class experiment-level object
## otu_table() OTU Table: [ 4710 taxa and 169 samples ]
## sample_data() Sample Data: [ 169 samples by 30 sample variables ]
## tax_table() Taxonomy Table: [ 4710 taxa by 6 taxonomic ranks ]
## phy_tree() Phylogenetic Tree: [ 4710 tips and 4709 internal nodes ]## phyloseq-class experiment-level object
## otu_table() OTU Table: [ 1996 taxa and 169 samples ]
## sample_data() Sample Data: [ 169 samples by 30 sample variables ]
## tax_table() Taxonomy Table: [ 1996 taxa by 6 taxonomic ranks ]
## phy_tree() Phylogenetic Tree: [ 1996 tips and 1995 internal nodes ]Check for the core ASVs
core.taxa.standard <- core_members(ps1.stool.rel2, detection = 0.001, prevalence = 50/100)

print(core.taxa.standard)
## [1] "94104936" "941049119" "94104948" "94104953" "94104940" "94104937"
## [7] "941049150" "94104955" "941049451" "94104943" "941049144" "94104962"
## [13] "94104956" "94104959" "94104974" "941049143" "941049112" "94104958"
## [19] "941049125" "941049109" "94104969" "94104960" "94104968" "941049102"
## [25] "941049320" "94104946"There are 16 ASVs that are core based on the cut-offs for prevalence and detection we choose. However, we only see IDs, not very informative. We can get the classification of these as below.
8.2 Core abundance and diversity
Total core abundance in each sample (sum of abundances of the core members):
8.3 Core visualization
8.3.1 Core heatmaps
This visualization method has been used for instance in Intestinal microbiome landscaping: insight in community assemblage and implications for microbial modulation strategies.
Note that you can order the taxa on the heatmap with the order.taxa argument.
# Core with compositionals:
prevalences <- seq(.05, 1, .05)
detections <- 10^seq(log10(1e-3), log10(.2), length = 10)

# Also define gray color palette
gray <- gray(seq(0,1,length=5))
p.core <- plot_core(ps1.stool.rel2,
                    plot.type = "heatmap",
                    colours = gray,
                    prevalences = prevalences,
                    detections = detections,
                    min.prevalence = .5) +
    xlab("Detection Threshold (Relative Abundance (%))")
print(p.core) 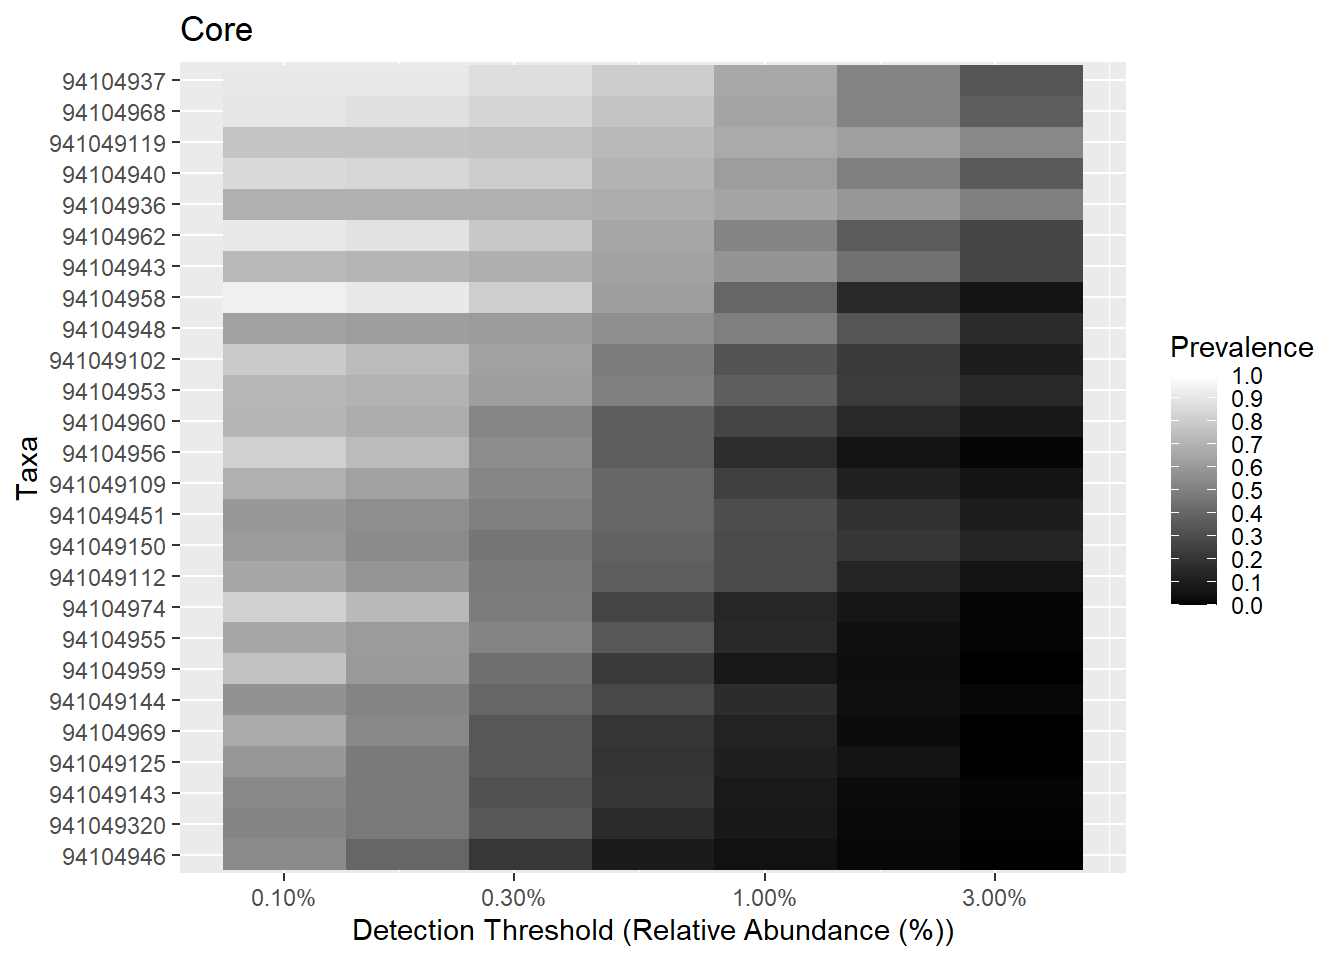
# Same with the viridis color palette
# color-blind friendly and uniform
# options: viridis, magma, plasma, inferno
# https://cran.r-project.org/web/packages/viridis/vignettes/intro-to-viridis.html
# Also discrete=TRUE versions available
library(viridis)
## Loading required package: viridisLite## Scale for 'fill' is already present. Adding another scale for 'fill', which
## will replace the existing scale.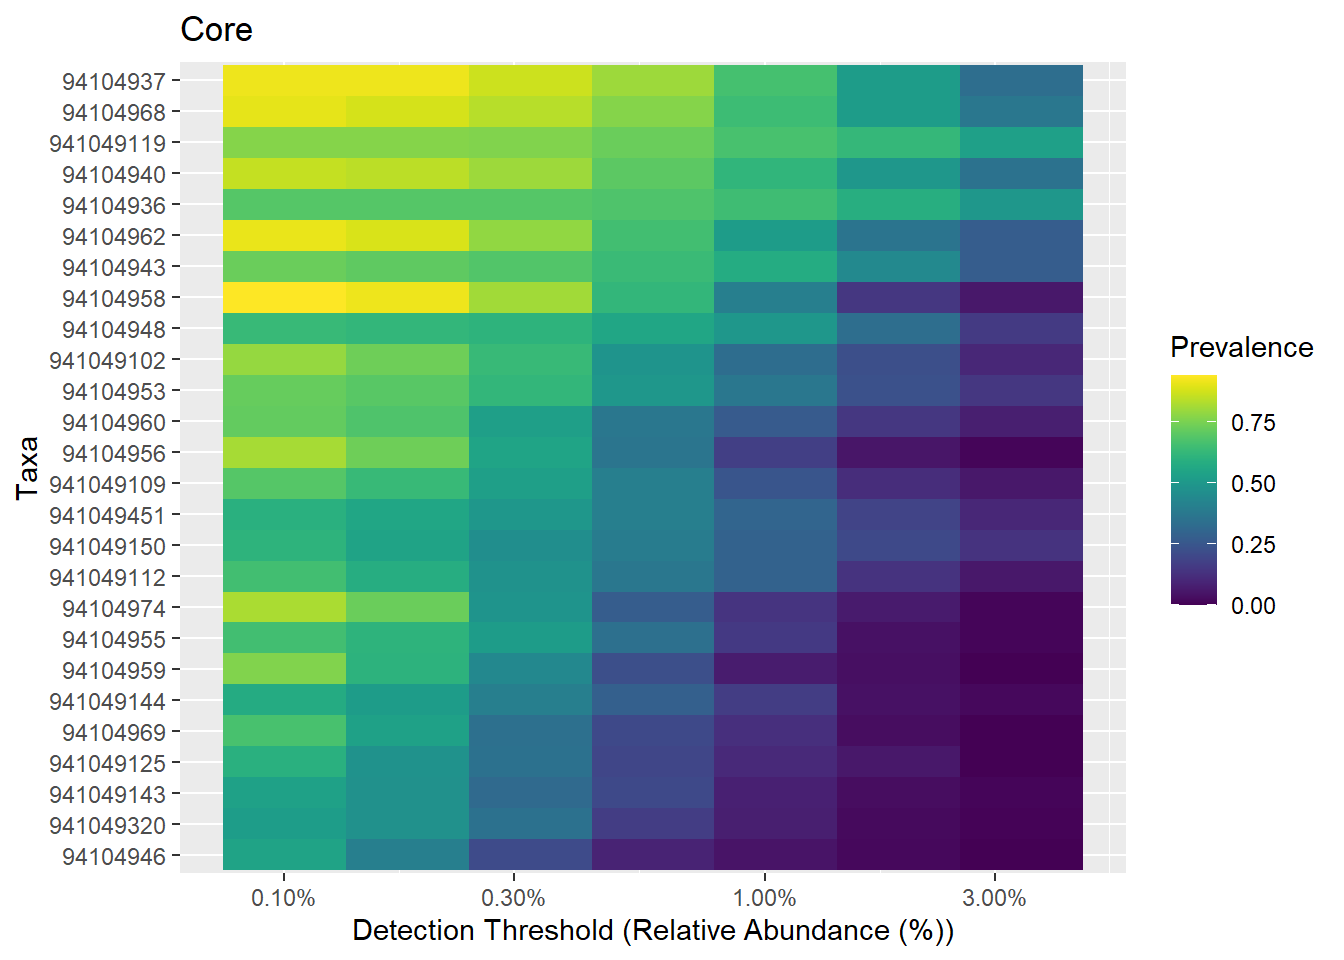
Color change
# Core with compositionals:
prevalences <- seq(.05, 1, .05)
detections <- 10^seq(log10(1e-3), log10(.2), length = 10)

# Also define gray color palette

p.core <- plot_core(ps1.stool.rel2,
                    plot.type = "heatmap",
                    colours = rev(brewer.pal(5, "Spectral")),
                    prevalences = prevalences,
                    detections = detections,
                    min.prevalence = .5) +
  xlab("Detection Threshold (Relative Abundance (%))")

print(p.core) 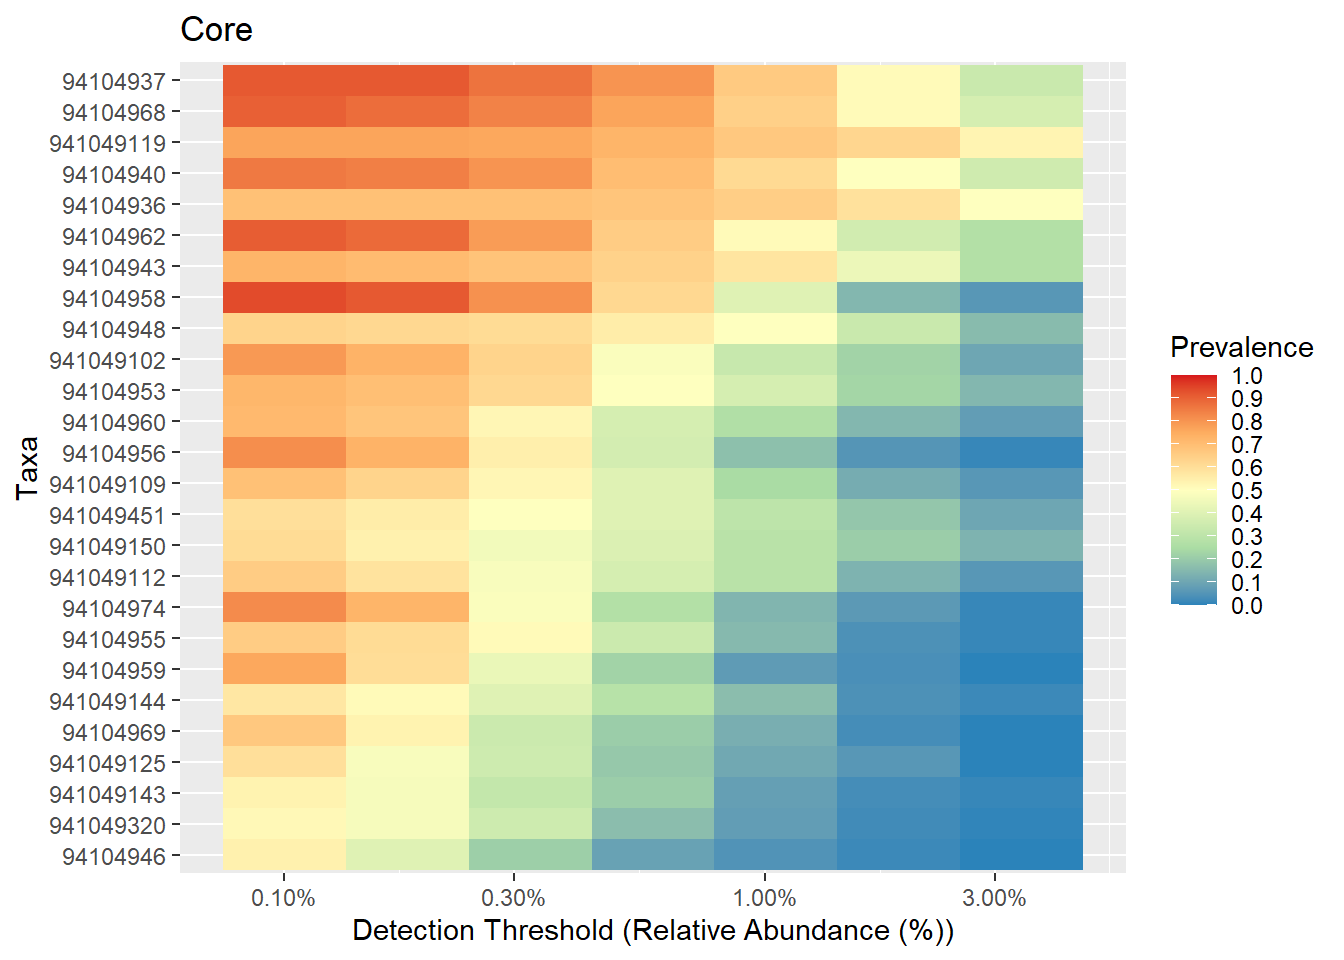
Use the format_to_besthit function from microbiomeutilities to get the best classification of the ASVs.
## Warning: replacing previous import 'ggplot2::alpha' by 'microbiome::alpha' when
## loading 'microbiomeutilities'
p.core <- plot_core(ps1.stool.rel2.f,
plot.type = "heatmap",
colours = rev(brewer.pal(5, "Spectral")),
prevalences = prevalences,
detections = detections,
min.prevalence = .5) +
xlab("Detection Threshold (Relative Abundance (%))")
p.core + theme(axis.text.y = element_text(face="italic"))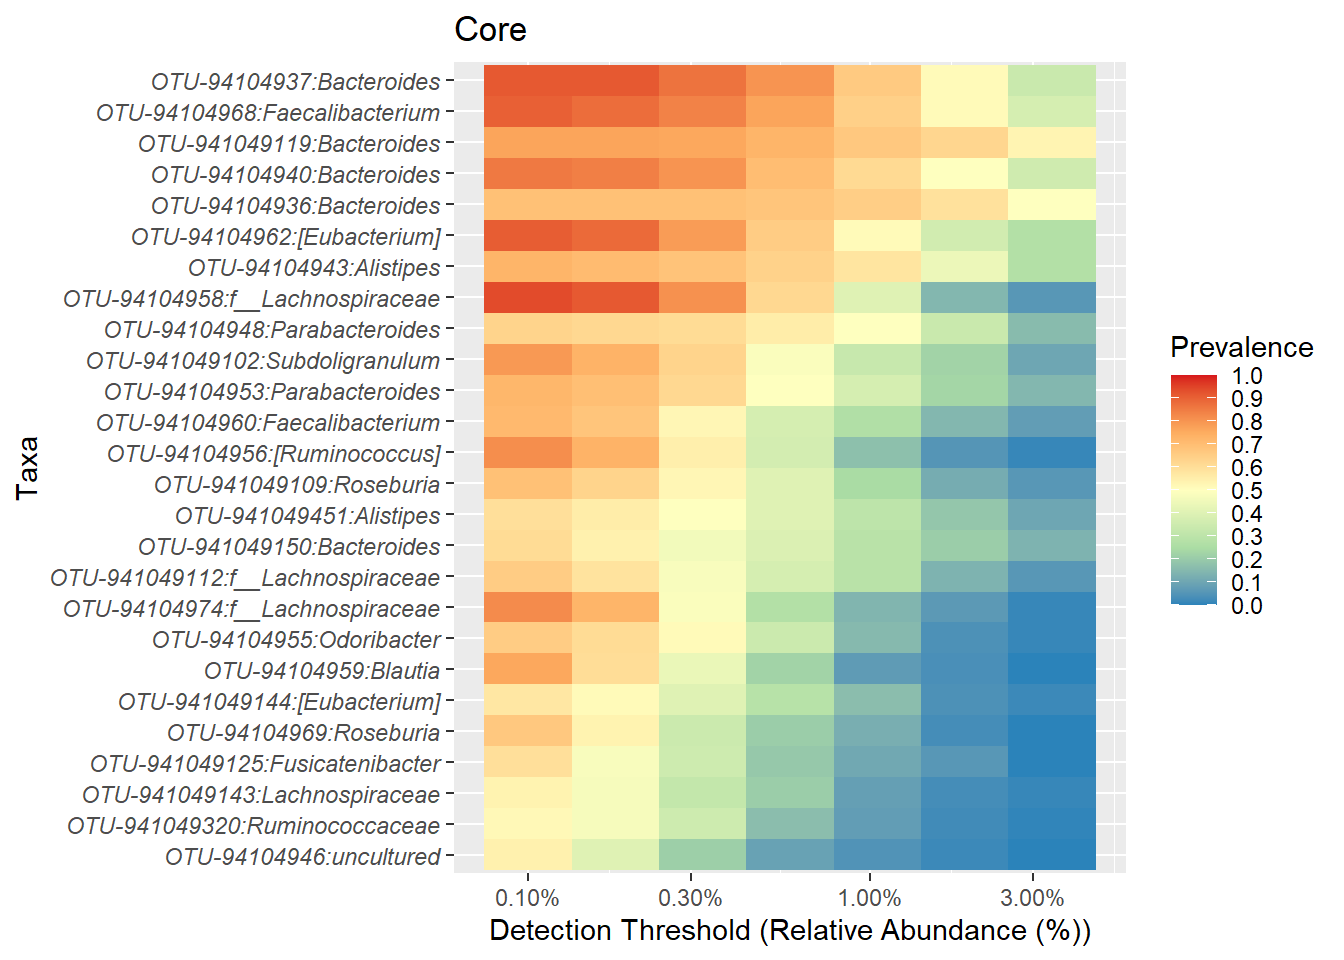

## R version 3.6.3 (2020-02-29)
## Platform: x86_64-w64-mingw32/x64 (64-bit)
## Running under: Windows 10 x64 (build 18363)
##
## Matrix products: default
##
## locale:
## [1] LC_COLLATE=English_Netherlands.1252  LC_CTYPE=English_Netherlands.1252
## [3] LC_MONETARY=English_Netherlands.1252 LC_NUMERIC=C
## [5] LC_TIME=English_Netherlands.1252
##
## attached base packages:
## [1] stats     graphics  grDevices utils     datasets  methods   base
##
## other attached packages:
## [1] viridis_0.5.1      viridisLite_0.3.0  dplyr_0.8.5        ggpubr_0.2.5
## [5] magrittr_1.5       RColorBrewer_1.1-2 microbiome_1.8.0   ggplot2_3.3.0
## [9] phyloseq_1.30.0
##
## loaded via a namespace (and not attached):
##  [1] Biobase_2.46.0              tidyr_1.0.2
##  [3] jsonlite_1.6.1              splines_3.6.3
##  [5] foreach_1.4.8               assertthat_0.2.1
##  [7] stats4_3.6.3                yaml_2.2.1
##  [9] ggrepel_0.8.2               pillar_1.4.3
## [11] lattice_0.20-40             glue_1.3.2
## [13] digest_0.6.25               ggsignif_0.6.0
## [15] XVector_0.26.0              colorspace_1.4-1
## [17] htmltools_0.4.0             Matrix_1.2-18
## [19] plyr_1.8.6                  microbiomeutilities_0.99.02
## [21] pkgconfig_2.0.3             pheatmap_1.0.12
## [23] bookdown_0.18               zlibbioc_1.32.0
## [25] purrr_0.3.3                 scales_1.1.0
## [27] Rtsne_0.15                  tibble_2.1.3
## [29] mgcv_1.8-31                 farver_2.0.3
## [31] IRanges_2.20.2              ellipsis_0.3.0
## [33] DT_0.12                     withr_2.1.2
## [35] BiocGenerics_0.32.0         survival_3.1-11
## [37] crayon_1.3.4                evaluate_0.14
## [39] nlme_3.1-145                MASS_7.3-51.5
## [41] vegan_2.5-6                 tools_3.6.3
## [43] data.table_1.12.8           lifecycle_0.2.0
## [45] stringr_1.4.0               Rhdf5lib_1.8.0
## [47] S4Vectors_0.24.3            munsell_0.5.0
## [49] cluster_2.1.0               Biostrings_2.54.0
## [51] ade4_1.7-15                 compiler_3.6.3
## [53] rlang_0.4.5                 rhdf5_2.30.1
## [55] grid_3.6.3                  iterators_1.0.12
## [57] biomformat_1.14.0           htmlwidgets_1.5.1
## [59] crosstalk_1.1.0.1           igraph_1.2.4.2
## [61] labeling_0.3                rmarkdown_2.1
## [63] gtable_0.3.0                codetools_0.2-16
## [65] multtest_2.42.0             reshape2_1.4.3
## [67] R6_2.4.1                    gridExtra_2.3
## [69] knitr_1.28                  permute_0.9-5
## [71] ape_5.3                     stringi_1.4.6
## [73] parallel_3.6.3              Rcpp_1.0.4
## [75] vctrs_0.2.4                 tidyselect_1.0.0
## [77] xfun_0.12